
TAC Infosec Ltd
About the Company
TAC Infosec Ltd, established in 2016, is a global cybersecurity firm specializing in risk-based vulnerability management and assessment solutions. The company offers a suite of security software products and services, including penetration testing, through a Software as a Service (SaaS) model.
Promoter Insights:
Mr. Trishneet Arora, a promoter and young tech wizard deeply passionate about cybersecurity, initially served as a Non-Executive Director since the company's inception in August 2016. At an Extraordinary General Meeting on January 08, 2024, members sanctioned his transition to Chairman, Executive Director, and CEO. He dropped out of school to pursue his passion and profession in cybersecurity, accumulating over 6 years of experience in the field.
Charanjit Singh, the Whole Time Director of TAC Infosec Limited, is the father of Trishneet Arora. With over 6 years of experience in financial management, decision-making, and entrepreneurship, he brings a diverse business acumen to the company. Charanjit is known for his expertise in planning and executing dynamic strategies aimed at achieving business objectives and driving growth.
Business Overview
Product Profile:
Company's flagship software product is ESOF (Enterprise Security in One Framework) which was launched in 2018. ESOF is a vulnerability management platform consisting of various product portfolios namely
ESOF Appsec: A unified vulnerability management solution to detect and protect web and app assets from risk-based vulnerabilities, featuring scheduled scans, a cyber risk score, historic trend analysis, and vulnerability prioritization.
ESOF VMP: A risk-based vulnerability management platform that identifies, prioritizes, safely exploits, and helps remediate vulnerabilities to prevent threats before they materialize.
ESOF VACA: A real-time vulnerability and risk assessment platform offering effortless deployment, cloud agent support, and productivity boosts through a unified IT landscape management tool.
ESOF PCI ASV: A solution for PCI compliance with features like automatic scheduled scans, detailed reporting, and an enterprise-wide compliance dashboard for secure cardholder data protection.
ESOF CRQ: A cyber risk quantification tool using AI and ML to assess financial risks, identify threats, and support informed decision-making.
All the products launched under ESOF Platform have wide range of applications ranging from vulnerability management solutions for web and application-based data, compliance assessment, and cyber risk quantification. ESOF also provides Asset Tiering, Business Unit Regrouping and Cyber score services.
Penetration Testing services:
Pen testing is a form of ethical hacking aimed at discovering and remedying security vulnerabilities in networks, systems, and applications. Company is a CREST (Council for Registered Ethical Security Testers) certified company, offering assurance to clients regarding the security of their data. Its services align with regulatory requirements such as GDPR and ISO 2700.
Clientele:
Banks & financial Institutions, government regulatory bodies and departments, large-scale enterprises (including business offices) like HDFC, Bandhan Bank, BSE, National Payments Corporation of India, DSP investment Managers Private Limited, Motilal Oswal Financial Services Limited and NSDL e-Governance.
In September 2024, company acquired 200 new customers across 32 countries including the USA, UK, Japan, France, India, etc. It made new clients like Microsoft, Gen Digital, Brother Industries, Sedric, Yext, Freshworks, and Lenovo and Brother Industries. The company aims to achieve 3,000 customers by March 2025 and 10,000 by March 2026.
Financial Report
Share Capital & Number of Employees
Share price and Volume (last 1 year):
Month and Year |
|---|
| Volume |
Prev Close
N/A
Sector
N/A
Market Cap
N/A
TTM PE
N/A
Sectoral PE Range
N/A
PE Remark
N/A
BSE
N/A
COMPANY TYPE | EVERGREEN |
|---|
| (IN INR CR) |
|---|
| (IN INR CR) |
|---|
Key Metrics
Market Cap
N/A
Current Price
N/A
PE Ratio
N/A
D/E Ratio
N/A
ROCE%
N/A
CWIP
N/A
ROIC%
N/A
Cash Conversion Cycle
N/A
ROE%
N/A
PEG Ratio
N/A
Business Segment

Enterprise Security in One Framework
The company's flagship software product, ESOF, offers a comprehensive vulnerability management platform with various solutions, including ESOF Appsec, VMP, VACA, PCI ASV, and CRQ. These tools cater to web and application security, compliance assessment, and cyber risk quantification, including features like Asset Tiering, Business Unit Regrouping, and Cyber Score services.

Penetration Testing services
Pen testing is a form of ethical hacking aimed at discovering and remedying security vulnerabilities in networks, systems, and applications. The company is a CREST (Council for Registered Ethical Security Testers) certified company, offering clients assurance regarding their data security.
Key Highlights & Management Guidance
Partnership:
Company recently unveiled its partnership with Google as an authorized lab for Mobile Apps Security Assessment (MASA) under the App Defence Alliance (ADA). As a MASA Authorized Assessor, Company will help developers and organizations comply with Google's rigorous mobile application security standards, ensuring thorough vulnerability testing and providing high-level security compliance. Before this recognition, it was also the exclusive recommended and preferred Assessor for Google's CASA (Cloud Application Security Assessment) Program.
Expansions:
The company has strategically broadened its cybersecurity presence in the USA and UAE through two key acquisitions, strengthening its position in these important markets. In the Middle East, the company established TAC Cyber Security Consultancy L.L.C. in the UAE to meet the increasing demand for cybersecurity solutions in the region. Meanwhile, in the USA, the acquisition of CyberSandia, which holds an exclusive IT services contract with the State of New Mexico, positions TAC Security as a leading player in American cybersecurity.
Expands into IoT Security Assessments:
TAC Security has become an ioXt Authorized Lab, expanding its capabilities into IoT Security Assessments. By joining an exclusive group of just eight companies worldwide, TAC Security is now able to conduct IoT Security Assessments under the prestigious ioXt Certification Program.
The company plans to incorporate these IoT Security Assessments into its ESOF Vulnerability Management Portfolio, with the service set to be officially rolled out in February 2025. This development further strengthens TAC Security’s position as the only holistic cybersecurity solutions provider offering more than eight certifications in the vulnerability assessment segment.
This strategic expansion will bolster TAC Security’s comprehensive platform for managing IT, OT, and IoT risks, aligning with its ambitious goal of reaching 10,000 global customers by March 2026.
Industrial Outlook
Introduction
The Indian IT industry is a key driver of economic growth, innovation, and global digital transformation. With a skilled workforce, strong export demand, rapid digital adoption, and supportive government policies, the sector continues to expand its global footprint. As investments in AI, machine learning, and digital infrastructure increase, India remains a dominant force in the global IT landscape.
Indian IT Industry Market Size
India’s IT industry has seen remarkable growth, solidifying its position in the global technology market. According to NASSCOM, the industry’s revenue reached $227 billion in FY22, marking a 15.5% year-on-year (YoY) growth, and further expanded to $245 billion in FY23.
Key Market Insights:
IT Spending: Projected to grow 11.1% in 2024, reaching $138.6 billion from $124.7 billion in 2023, driven by investments in infrastructure, digital transformation, and emerging technologies.
Software Industry Growth: The Indian software product industry is expected to reach $100 billion by 2025, fueled by global expansion and enhanced delivery centers.
Data Annotation Market: Valued at $250 million in FY20, with the US contributing 60% of the market. It is expected to grow exponentially to $7 billion by 2030 due to rising AI adoption.
Projected Industry Revenue: The Indian IT sector is on track to reach $350 billion by 2026, contributing 10% of the GDP. IT exports grew 9% in constant currency terms to $194 billion in FY23.
Growth Drivers of the Indian IT Industry
1. Diverse End-User Market & Skilled Workforce
The demand for IT services extends beyond traditional tech companies to industries such as pharmaceuticals, retail, and utilities. Large organizations increased IT spending by 14% in 2015, indicating a broadening customer base. Additionally, India’s vast pool of technically skilled professionals continues to drive sector growth.
2. Digital Transformation
India’s digital ecosystem is expanding rapidly, supported by initiatives like Digital India and technological innovations such as Unified Payments Interface (UPI). UPI processes nearly 10 billion monthly transactions, accounting for 45% of global real-time payments. The increase in digital transactions from 300 crore in 2019 to 1,052 crore in 2023 highlights the nation’s digital progress.
With 850 million internet users and some of the lowest data costs globally, digital transformation has driven sectors like fintech, e-commerce, and government services.
3. Strong IT Export Demand
India’s IT and BPM exports have grown 14% annually over the past two decades, reaching $254.5 billion in 2021-22. IT services alone contributed $157 billion, employing 5 million people globally. The international demand for Indian IT talent continues to propel growth, reinforcing India’s position as a global technology leader.
4. Breakthroughs in AI & Machine Learning
The Indian technology industry recorded $227 billion in revenue in 2022, driven by advancements in AI, IoT, big data, cybersecurity, and robotics. The Indian AI market is projected to grow 20% annually over the next five years, making it the world’s second-fastest-growing AI market.
AI applications in banking, finance, fraud detection, and cybersecurity continue to expand, fueling IT sector growth. Government initiatives like the Digital India program are allocating $477 million to further AI-driven innovations.
SWOT Analysis of India’s IT & BPM Sector
Strengths:
Consistent Growth: Revenue reached $227 billion in FY22, projected to hit $350 billion by 2026.
Skilled Workforce: India has a vast pool of technical talent.
Cost Advantage: Lower operational costs make India a preferred outsourcing destination.
Weaknesses:
Dependence on Global Markets: Heavy reliance on the US and Europe.
Shortage of Skilled Talent in Emerging Tech: Gaps in AI, machine learning, and cybersecurity expertise.
Infrastructure Limitations: Some regions lack advanced IT infrastructure.
Opportunities:
Expansion in Digital Services: Growing cloud computing, AI, and cybersecurity adoption.
Automation & AI Growth: Increasing use of AI across industries.
Government Support: Policies and incentives boost technology adoption.
Threats:
Intense Global Competition: Countries like China and the Philippines offer competitive IT services.
Regulatory Challenges: Data privacy and security regulations impact compliance costs.
Geopolitical Risks: Trade disputes and conflicts can affect IT exports.
Government Initiatives Supporting IT Growth
Union Budget 2025-26: Government allocates ₹95,298 crore to Telecom & IT sectors.
IndiaAI Mission: Cabinet approved ₹10,300 crore (~$1.2 billion) to enhance AI ecosystems.
PLI Scheme 2.0: ₹17,000 crore (~$2.06 billion) allocated for IT hardware manufacturing.
Focus on Emerging Tech: Investments in cybersecurity, blockchain, and hyper-scale computing.
Future Outlook:
India remains a global leader in IT services and outsourcing, with substantial opportunities in emerging technologies. The IT sector’s revenue is forecasted to reach $350 billion by 2026, contributing 10% to India’s GDP.
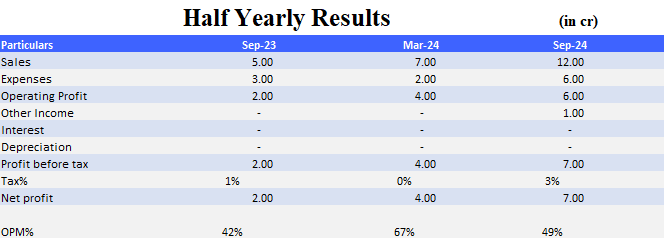
Financial Highlights
| PARTICULARS | H2FY24 | H1FY25 |
|---|---|---|
| Sales | ₹7 Cr | ₹12 Cr |
| OPM% | 67% | 49% |
| Net Profit | ₹4 Cr | ₹7 Cr |
Shareholding Pattern
Apr'2024 | Sep'2024 | |
|---|---|---|
| Promoters | 56.94% | 56.94% |
| FIIs | 9.81% | 3.78% |
| DIIs | 2.23% | 0.00% |
| Retailers | 31.01% | 39.28% |
Capsule’s View